
How to Analyse Survey Results Without Spending 3 Days in Excel
Most teams export a CSV and then stare at it for hours. Here's a faster, smarter approach — and why AI-generated reports change how research gets communicated.
You've just closed a survey. Maybe 200 responses came in over 10 days. Your stakeholders are waiting. And you've just exported the CSV.
What happens next is painfully predictable. You open Excel. You start building pivot tables. Three hours later, you have a spreadsheet that only you can understand — and presenting it to a non-researcher audience is going to take another afternoon.
This is the hidden cost of research that nobody measures: not the time to design or run the study, but the hours lost between raw data and a decision-ready insight.
Why Excel is slowing your team down
Excel is a powerful tool — but it was never designed for user research analysis. When you use it for survey data, you're fighting against its grain. Every formula you write, every chart you build, every filter you apply is a step that could be automated.
There's also a deeper problem. Excel externalises your analysis logic into a file that nobody else can maintain. When the researcher who built the spreadsheet is on leave or leaves the company, the analysis becomes an artifact nobody trusts.
Sharing a raw Excel file with stakeholders is not the same as sharing an insight. Data is not a finding. Findings require interpretation — and interpretation needs to be communicated in the language of decisions, not cells.
What good survey analysis actually looks like
Before we get into the how, it's worth being clear about what we're aiming for. Good survey analysis has three qualities:
- It answers the research question — not just “what did people say” but “what should we do based on what people said”.
- It is reproducible — another researcher should be able to verify your conclusions using the same data.
- It is shareable without translation — a PM or designer who wasn't in the room should be able to read your output and understand what it means for the product.
Most teams hit the first point adequately. Almost nobody hits the third. The gap between a researcher's insight and a stakeholder's action is where research dies.

The 5-step framework for faster analysis
This framework works whether you have 50 responses or 5,000. The steps are the same — what changes is the automation available at each step.
What are the 3 things you need to know? Write them down before you touch a single cell. This prevents analysis paralysis and forces clarity on what a “good” result looks like.
Most survey tools let you filter by every demographic simultaneously. Resist this. Start with the 1–2 segments that your research question actually requires. Add others only if the initial segmentation doesn't explain the pattern.
MCQ and rating data tells you what. Open-text responses tell you why. Analyse them separately. The qual context is what transforms a percentage into a narrative, but mixing the two too early creates confusion.
The most valuable findings are the ones you didn't set out to find. Before you close the analysis, explicitly ask: “Is there anything in this data that contradicts our assumptions?”
Every finding should be expressible in a single, declarative sentence: “Users aged 25–34 in Tier 1 cities are 2.3× more likely to abandon onboarding at the payment step.” If you can't do this, you don't have a finding — you have data.
Write your findings as headlines, not as descriptions. “Onboarding drop-off is highest at step 3” is a description. “Step 3 is costing you 40% of signups” is a finding that drives action.
How AI-generated reports change the equation
The framework above makes you a better analyst. But it doesn't solve the speed problem — or the translation problem.
That's where AI-generated reports fundamentally change the workflow. Instead of spending hours formatting charts and writing slide copy, you point an AI at your data and get a structured, ready-to-present output. The researcher's job shifts from production to editorial — reviewing, refining, and adding judgment to an AI-generated first draft.
In practice, at Lumor, this looks like this: you run a survey, responses come in, and the AI Summary feature reads all your data and surfaces the key patterns automatically. It identifies outliers, spots sentiment in open-text responses, and groups themes — in seconds.
Then the AI Slides feature converts those findings into a polished deck. Not a template you fill in. An actual presentation, with charts, callout stats, and narrative flow, built from your specific data.
The Lumor workflow: start to insight in under an hour
Here's what the end-to-end workflow looks like when you're using Lumor:
- Build your survey — in the editor (20 plus question types, branching logic, AI-assisted creation).
- Distribute via collector links — email, embedded, or via the participant panel for recruited respondents.
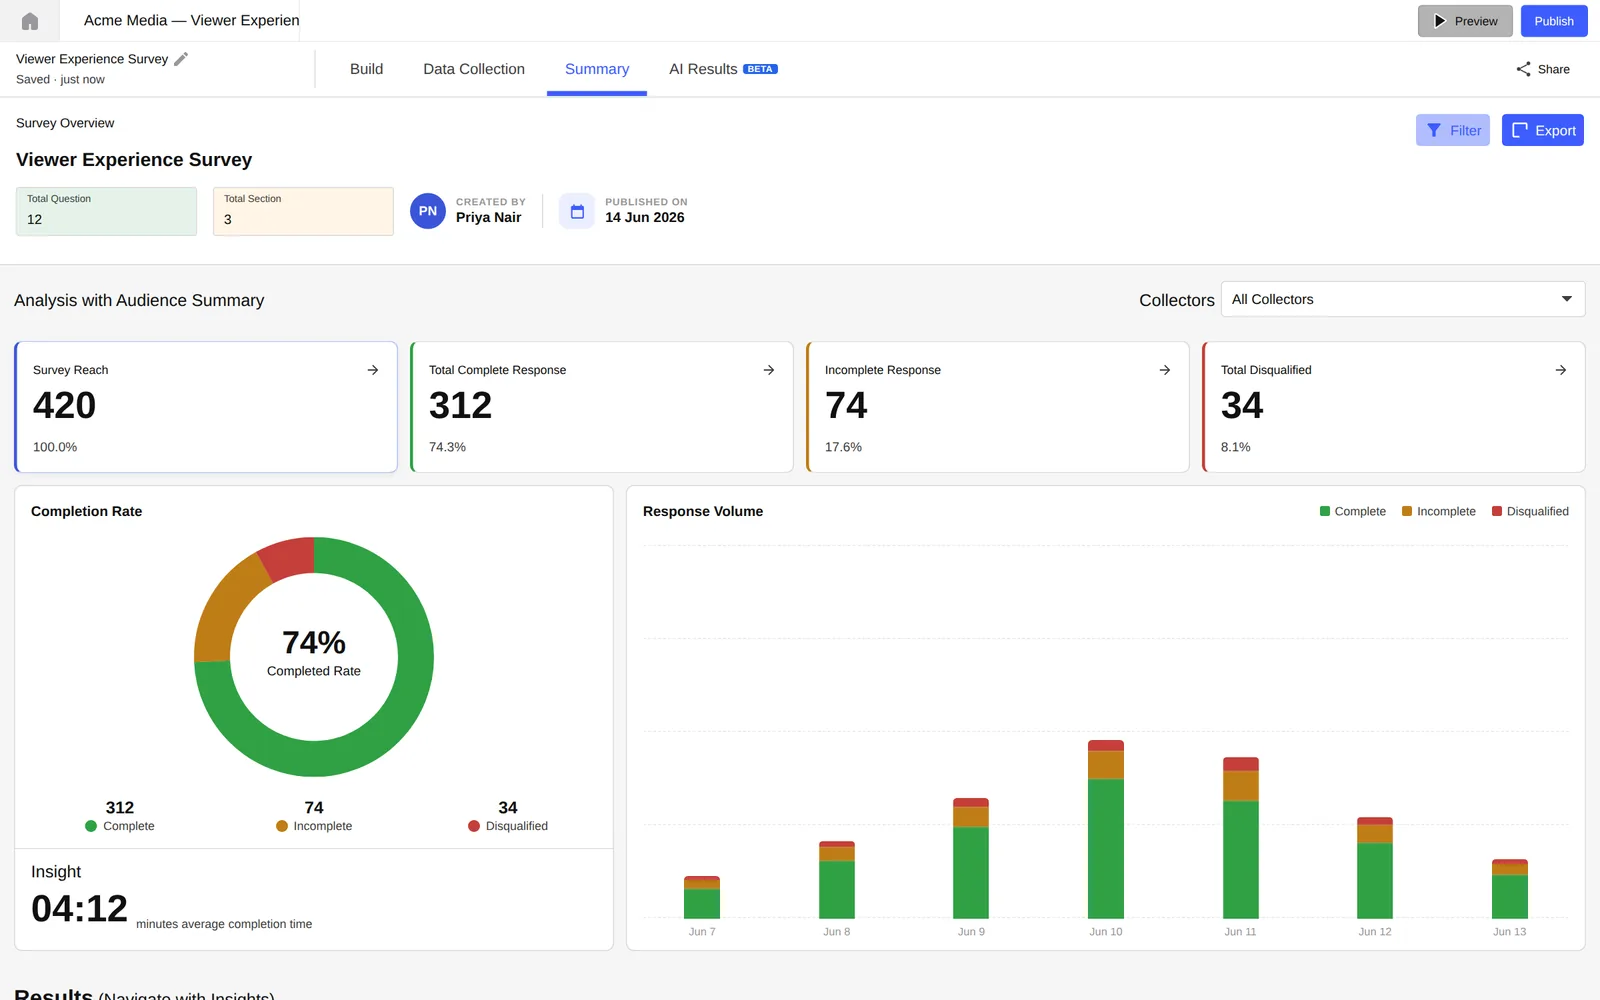
- Monitor in Summary tab — completion rates, reach, and response volume in real time.
- Use AI Chat in the Result tab — ask questions directly: “What did users in Bengaluru say about pricing?” and get a synthesised answer, not a filter.
- Generate your report in Studio — one click for AI Slides (presentation deck) or AI Doc Report (PDF). Review, refine, share.
The entire workflow — from closing the survey to sending a shareable report — takes under an hour for a 200-response study. Compare that to the 3–5 hours the same study would take in Excel.
Key takeaways
- Excel was not designed for user research analysis. Stop fighting it and use a tool that is.
- The gap between data and decision is where research loses its value. Anything that shortens this gap compounds over time.
- AI doesn't replace the researcher's judgment. It removes the production work so your judgment has more time to operate.