
From Raw Data to Stakeholder Deck in 10 Minutes
Lumor's AI Slides feature turns survey responses into a polished presentation automatically. A complete walkthrough — from closing your survey to hitting send.
You just closed a survey. 300 responses. Your stakeholders want a deck by end of day. In the old world, this means 4 hours of Excel, 2 hours of PowerPoint, and a presentation that still needs a 10-minute walkthrough to make sense.
Lumor's AI Slides feature changes this equation entirely. It reads your survey data, identifies the key patterns, writes the narrative, builds the charts, and produces a complete slide deck — in about 90 seconds.
The presentation problem nobody talks about
There's a lot of discussion in the UX research community about how to run better studies. How to write better questions. How to recruit better participants. Far less discussion about what happens after the data comes in.
The dirty secret is that most research dies in the presentation layer. Insights that could change a product decision get buried in a 40-tab Excel file that nobody opens twice. Or they get compressed into a 3-bullet summary that strips out all the nuance. Or they get presented in a researcher-native format — cross-tabs, significance scores, response distributions — that means nothing to a product lead who needs to decide what to build next sprint.
The goal of AI Slides is not to replace the researcher's judgment. It's to remove the production work — the formatting, the charting, the slide copy — so that judgment has more space to operate.
Researchers are knowledge workers, not production workers. Every hour spent formatting a slide is an hour not spent thinking about what the data means. AI handles the production. You handle the meaning.
Before AI Slides vs after
The old workflow
- Export CSV from survey tool
- Clean data in Excel (30 min)
- Build pivot tables for each question (45 min)
- Create charts in PowerPoint (60 min)
- Write slide titles and narrative (45 min)
- Format and align everything (30 min)
- Review and fix errors (20 min)
- Total: 3–4 hours
The Lumor workflow
- Close survey in Lumor
- Click Studio → AI Slides
- AI generates complete deck (90 sec)
- Review the output (5 min)
- Add your editorial layer (5 min)
- Export and share
- Total: ~10 minutes
Step-by-step: the 10-minute workflow
Here's exactly what happens from the moment your survey closes to the moment you share the deck. The timestamps are real — this is the workflow our beta users actually reported.
In the Data Collection tab, switch your collector to Offline. Responses are locked. You're ready to analyse.
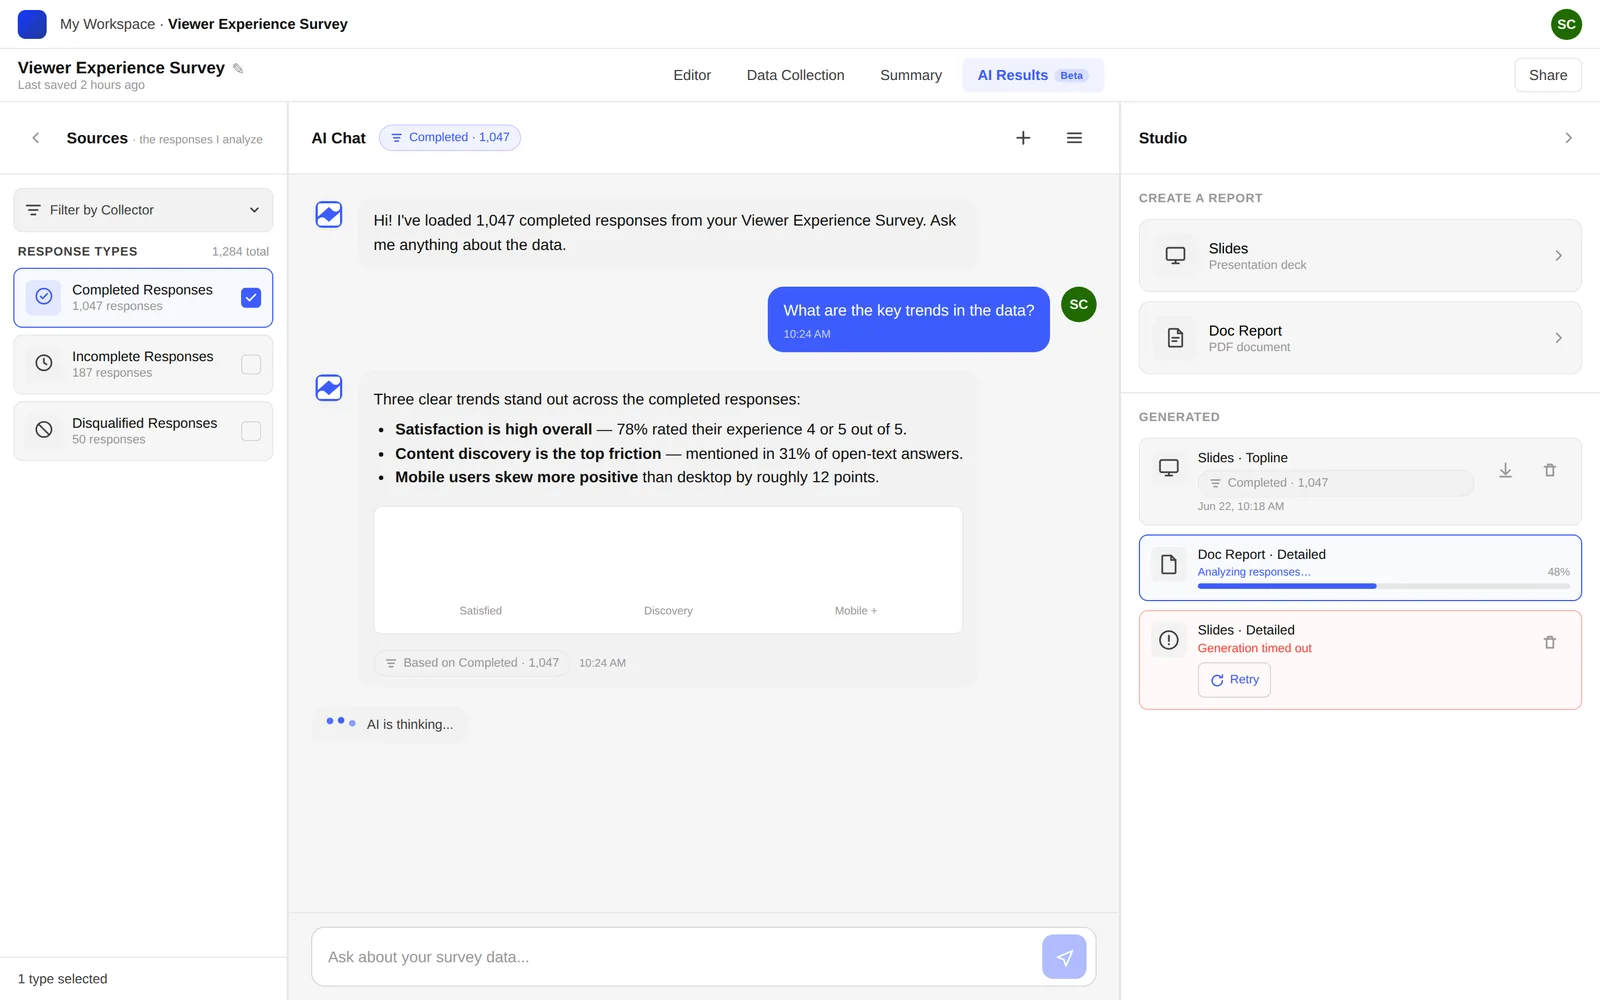
Before generating the deck, use AI Chat in the Result tab to ask targeted questions: “What were the top 3 themes in open-text responses?” or “Which segment had the lowest NPS?” This gives you context to evaluate the AI deck against.
Click Studio → AI Slides. Lumor reads every response, identifies the key patterns, writes the narrative, builds the charts, and produces a complete slide deck. This takes approximately 60–90 seconds depending on response volume.
The AI produces 8–14 slides depending on survey complexity. Read through once with your stakeholder's eyes. Is the story clear? Does the headline on each slide match what the chart shows? Are the recommendations actionable?
The AI deck is a first draft, not a final product. Add your voice to the executive summary slide. Flag the one finding you consider most important. Add any context the AI couldn't have known.
Export as a PowerPoint file or share a live link directly from Lumor. Team members with view access can see the deck without needing to download anything.
What the AI actually builds
It's worth being specific about what the AI Slides output looks like, because “AI-generated deck” covers a lot of ground — from basic chart dumps to genuinely useful research communication.
Lumor's AI Slides generates the following slides for a typical survey:
- Title slide → survey name, date, response count, key stat headline.
- Executive summary → 3 bullet findings written in plain language. This is the slide your PM will read and remember.
- Methodology slide → sample size, audience, collection dates, completion rate.
- One slide per major question cluster → chart + AI-written insight sentence. Not just the chart — the interpretation.
- Open-text themes slide → if your survey had open-ended questions, the AI identifies and names the top 4–6 themes, with representative quotes.
- Segment comparison slide → if you collected demographic or role data, the AI surfaces the most interesting between-segment differences.
- Recommendations slide → 3 specific, actionable recommendations written from the data. Not generic research recommendations — ones derived from your actual findings.
The AI writes insight sentences, not just chart labels. Instead of “62% of respondents selected Option A”, it writes “Most users prioritise speed over customisation — an important signal for the onboarding redesign.” This is the difference between describing data and communicating findings.

Key takeaways
- The deck is the deliverable. Insights that don't reach stakeholders don't influence decisions. AI Slides ensures your findings are presentation-ready in minutes.
- AI writes the first draft. The AI handles structure, charts, and narrative. You handle interpretation, context, and the editorial layer that makes it yours.
- 10 minutes is real. Our beta users consistently report going from survey close to shareable deck in under 10 minutes. The time savings compound across every study.